(Posted by Bruce Goerlich on his blog, Thought Lobs, on 23rd April, 2015) Original article
What’s Really Happening with TV Viewing? A Second Look at Its Strength
A blog or two back I looked at the “Stürm und Drang” (thunder and lightning for those of you not into German) about levels of TV viewing. I concluded that the situation was not as dire as the industry was saying. This blog takes a second look and again confirms the underlying strength of TV.
Because there are “lies, damn lies, and statistics,” I looked at the data in three ways. First, I show that there is power in strong original content. Second, I look at an analysis of Rentrak data by a financial analyst that shows the stability in overall TV reach. Finally, I zero in on the individual components of live and time-shifted viewing.
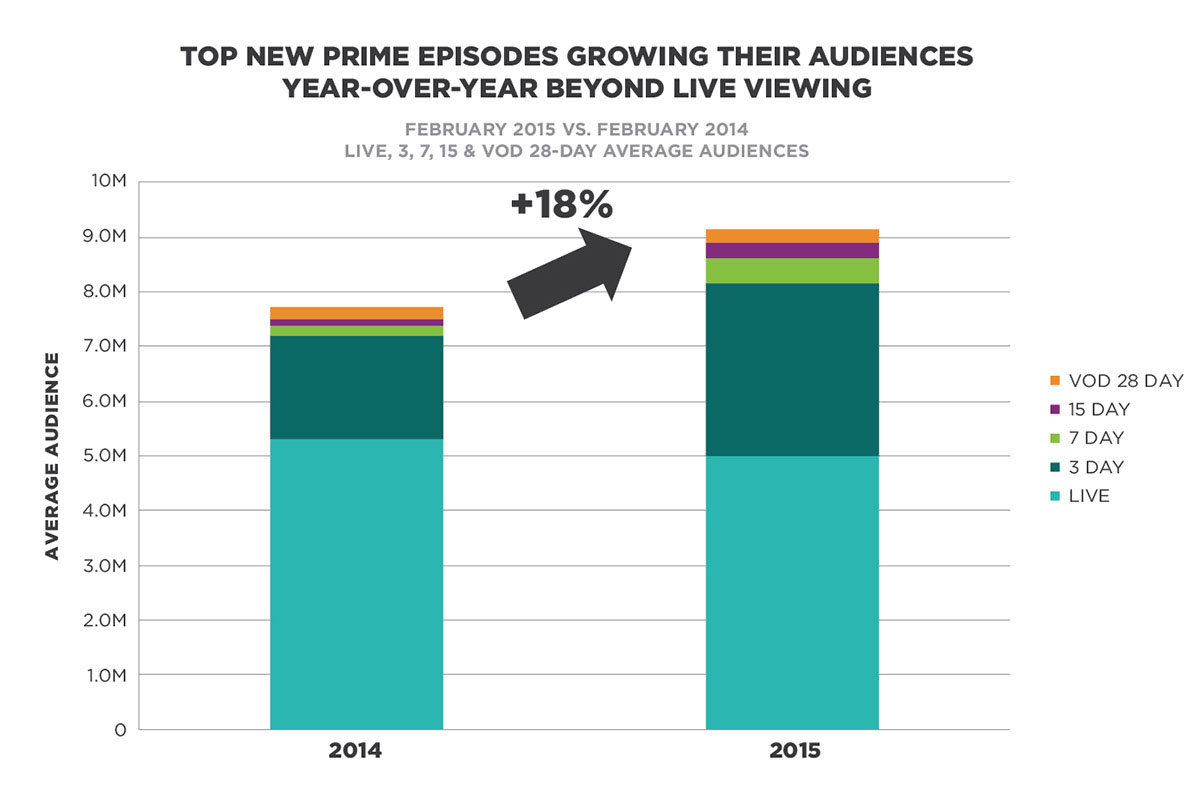
I started out with the original episodes of the 13 strongest Primetime shows for February of this year versus February of last year (when the programs aired) to which Rentrak had Video on Demand (VOD) reporting rights. Original episodes are important because reruns have much less time shifting. As the chart below shows, there was an 18 percent growth of viewing to these episodes year-over-year, driven not by live, but by all the permutations of DVR and VOD time shifting.

One may say that the Olympics skewed the results. But the growth was across all the networks we track, not just NBC’s competitors (NBC hosted the February Olympics). Note also that these are not weight averaged by duration, leading to some differences in the overall average.

For the second analysis, following T.S. Eliot’s adage that great artists never borrow, only steal, let me show you some data from Brian Wieser, CFA, a Senior Research Analyst at Pivotal Research Group ([email protected]). In a release analysis, he focused on the value of reach to advertisers, and in fact, how reach for the top 20 networks has not fundamentally changed in the past four years.
Brian looked at monthly average reach from Rentrak for the top 20 networks for live viewing. Finally, I did my own analysis focusing on Rentrak’s total hours of live, DVR (up to 15 days) and Video on Demand (VOD) viewing levels for Sept. 2013 through Feb. 2014 compared to Sept. 2014 through Feb. 2015. Our live and DVR viewing is projected from approximately 15 million households and the VOD playback comes from 114 million TVs. The chart below shows what I found. First, there seems to be an overall 4.1 percent decline in TV viewing across live, DVR and VOD playback from the major sources (234 billion hours season-to-date versus last year’s 244 billion hours). The big driver in the loss is the level of live viewing. Live is down by 9.6 percent (193 billion season-to-date versus 214 billion hours last year). However, live viewing still accounts for 83 percent of total viewing hours. The uptick is in time shifting. The combined increase in DVR and VOD watching was 35 percent (30 billion versus 40 billion hours). What is missing from the chart is the amount of streamed viewing through connected devices. Rentrak does collect streaming information, but it is currently proprietary to participating clients and as yet not included in our syndicated product line. Importantly, our internal analyses confirm that, based on the programs we do track, audiences across multiple screens are generally “whole” year-over-year. These facts suggest that consumers are watching at least as much TV content as ever—albeit at different times and on different screens. So, bottom line, what do we have with TV? The death of TV is greatly exaggerated. [1] Rentrak’s total hours of live, DVR (up to 15 days) and VOD viewing levels for Sept. 2013 through Feb. 2014 compared to Sept. 2014 through Feb. 2015. Brian Wieser, “TV: Reaching to the Converted,” April 10, 2015. — In case you don’t know, I am Bruce Goerlich, Chief Research Officer at Rentrak, the global standard in movie measurement and your TV Everywhere measurement and research company. I have been in the research end of the marketing business for more than 30 years primarily on the ad agency side, with my last stint prior to Rentrak in the role of President, Strategic Resources Zenith Optimedia North America. Somewhere along the way I morphed from young Turk to old fogey. Now that I have grey hair and am horizontally-challenged, I can speak with some authority on advertising and research issues – which I will do from time-to-time on this blog. 
